

FISHNET.RU produces early report on trends in Russian seafood importation in 2006-2007
In 2007 the Russian importers purchased nearly one million metric tons of finfish and other aquatic species, namely 997,600 tonnes, at a total value of more than 1.7 billion USD with the rise on the previous year 2006 amounting to 29% in volume and 44% in value. The conclusion has been made by FISHNET analysts (http://www.fishnet-russia.com/, https://www.fishnet.ru/) after a study of official statistics of Russia's Federal Customs Service on the nation's imports of products of HSC Group 03 "Fish, Shellfish, Mollusks and Other Aquatic Invertebrates".
Speaking about countries of origin, Norway remained the leading producer of seafood imported into Russia in 2007 with a result of 373,000 tonnes worth ca.630 million USD. Growth of Russia's import of Norwegian finfish and shellfish into Russia amounted to 39% in volume and 44% in value as compared to 2006.
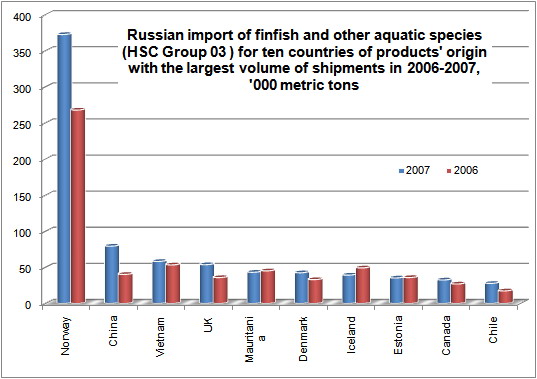
The second place with a large gap from the leader was taken by China with a result of ca.80,000 tonnes worth more than 174 million USD. However, the growth rates of Russia's imports of Chinese fish was much higher as compared to those of Norway: 97% in volume and 98% in value.
The third place in volume of import supplies was taken by Vietnam. More specifically, in 2007 Russian importers purchased 58,000 tonnes of Vietnamese fish worth nearly 115 million USD. As compared to 2006, the growth rates were not very high amounting to 9% in volume and nearly 7% in value. Obviously, the growth of imports of Vietnamese fish in Russia was impeded by the restrictions of Russia's Federal Service for Veterinary and Phytosanitary Surveillance Rosselkhoznadzor according to which seafood importation from Vietnam was allowed only from plants approved by the Russian vets. On the other hand, the above mentioned positive dynamics of the Russian imports of Vietnamese fish is indicative of the market players' adaptation to the new veterinary requirements and further development of Russian-Vietnamese trade in seafood products.
Along with Norway, China and Vietnam, top10 of leading producers (countries of origin) of seafood products imported to the Russian Federation also include UK, Mauritania, Denmark, Iceland, Estonia, Canada and Chile.
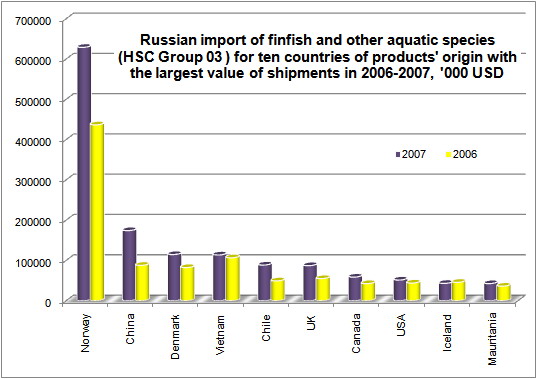
The rating of producing countries in value of supplies is somewhat different with Denmark stepping up as the third leading producer after Norway and China. The above three leaders are followed by Vietnam, Chile, UK, Canada, the USA, Iceland and Mauritania.
In the future issues of the Russian Fish Report we shall publish a detailed comparative analysis of Russia's seafood imports in 2004-2007 for selected HSCs such as 030211 chilled trout, 0302120000 chilled salmon, 030321 frozen trout, 0303220000 frozen salmon, 0303510000 frozen herring, 030374 frozen mackerel, 0304191300 chilled salmon fillets, 0304191500 chilled trout fillets, 0304291300 frozen salmon fillets, 0304291500 frozen trout fillets, 0304298500 frozen Alaska pollock fillets, 030613 frozen shrimps, 0307991100 frozen squid, 030378 frozen whiting, 0304295500 and 0304295600 frozen whiting fillets, 030729 frozen sea scallops and 0304990500 surimi.
Russia's import of finfish and other aquatic species of the HSC Group 03 according to official data of the nation's Federal Customs Service in 2006-2007
Country of origin | 2007 | 2006 | 2007 versus 2006 | ||||||
| Value, USD | Volume, kg | Price in USD per kg | Value, USD | Volume, kg | Price in USD per kg | Value, +/- %% | Volume, +/- %% | Price per kg, +/- %% | |
| Argentina | 28267582 | 17189000 | 1.64 | 24872292 | 14958542 | 1.66 | 13.65% | 14.91% | -1.10% |
| Armenia | 804471 | 168474 | 4.78 | 797894 | 239130 | 3.34 | 0.82% | -29.55% | 43.11% |
| Australia | 707273 | 529671 | 1.34 | 1427909 | 1562175 | 0.91 | -50.47% | -66.09% | 46.09% |
| Austria | 1429 | 122 | 11.71 | 100.00% | 100.00% | 100.00% | |||
| Azerbaijan | 510052 | 709995 | 0.72 | 605553 | 966204 | 0.63 | -15.77% | -26.52% | 14.62% |
| Bangladezh | 16805529 | 3056991 | 5.50 | 5630642 | 1188908 | 4.74 | 198.47% | 157.13% | 16.08% |
| Belgium | 1989396 | 453522 | 4.39 | 3197093 | 687187 | 4.65 | -37.77% | -34.00% | -5.72% |
| Canada | 58855579 | 32634260 | 1.80 | 42722631 | 27090775 | 1.58 | 37.76% | 20.46% | 14.36% |
| Chile | 88854381 | 27906215 | 3.18 | 49422663 | 17483924 | 2.83 | 79.78% | 59.61% | 12.64% |
| China | 174363966 | 79440153 | 2.19 | 88058275 | 40352590 | 2.18 | 98.01% | 96.87% | 0.58% |
| Columbia | 17147 | 69 | 248.51 | 31022 | 60 | 517.03 | -44.73% | 15.00% | -51.94% |
| Cyprus | 5770876 | 967735 | 5.96 | 3322012 | 761164 | 4.36 | 73.72% | 27.14% | 36.64% |
| Denmark | 114933900 | 42625330 | 2.70 | 82546312 | 33126073 | 2.49 | 39.24% | 28.68% | 8.21% |
| Ecuador | 6640696 | 2826820 | 2.35 | 3247969 | 1400271 | 2.32 | 104.46% | 101.88% | 1.28% |
| Estonia | 15904193 | 35443454 | 0.45 | 20333788 | 36027124 | 0.56 | -21.78% | -1.62% | -20.50% |
| EU countries | 288100 | 190152 | 1.52 | 100.00% | 100.00% | 100.00% | |||
| Falkland Islands | 1015665 | 1450951 | 0.70 | 122717 | 175310 | 0.70 | 727.65% | 727.65% | 0.00% |
| Faroe Islands | 23097996 | 7012704 | 3.29 | 24432088 | 12799656 | 1.91 | -5.46% | -45.21% | 72.55% |
| Fiji | 251314 | 100525 | 2.50 | 92450 | 39100 | 2.36 | 171.84% | 157.10% | 5.73% |
| Finland | 19063348 | 25901955 | 0.74 | 8929231 | 18641771 | 0.48 | 113.49% | 38.95% | 53.65% |
| France | 7843138 | 1821034 | 4.31 | 5015259 | 839864 | 5.97 | 56.39% | 116.82% | -27.87% |
| Georgia | 84238 | 600880 | 0.14 | 44005 | 305784 | 0.14 | 91.43% | 96.50% | -2.58% |
| Germany | 3358053 | 1133962 | 2.96 | 3630164 | 1264536 | 2.87 | -7.50% | -10.33% | 3.16% |
| Greece | 511006 | 187871 | 2.72 | 406295 | 165657 | 2.45 | 25.77% | 13.41% | 10.90% |
| Greenland | 8247352 | 3197452 | 2.58 | 1650033 | 707758 | 2.33 | 399.83% | 351.77% | 10.64% |
| Guinea | 47810 | 5870 | 8.14 | -100.00% | -100.00% | -100.00% | |||
| Hong Kong | 6133 | 29 | 211.48 | 2919 | 12 | 243.25 | 110.11% | 141.67% | -13.06% |
| Iceland | 43216712 | 39416117 | 1.10 | 45899563 | 49364077 | 0.93 | -5.85% | -20.15% | 17.92% |
| India | 9047452 | 3363887 | 2.69 | 2529468 | 807707 | 3.13 | 257.68% | 316.47% | -14.12% |
| Indonesia | 5701643 | 2004211 | 2.84 | 2728927 | 995225 | 2.74 | 108.93% | 101.38% | 3.75% |
| Ireland | 8641219 | 5565833 | 1.55 | 1617197 | 1062233 | 1.52 | 434.33% | 423.97% | 1.98% |
| Italy | 1354192 | 213527 | 6.34 | 365275 | 83234 | 4.39 | 270.73% | 156.54% | 44.51% |
| Izrael | 1603 | 39 | 41.10 | 5257 | 125 | 42.06 | -69.51% | -68.80% | -2.27% |
| Japan | 1408638 | 664348 | 2.12 | 1853985 | 853996 | 2.17 | -24.02% | -22.21% | -2.33% |
| Kazakhstan | 29014090 | 23681288 | 1.23 | 21097195 | 22429228 | 0.94 | 37.53% | 5.58% | 30.25% |
| Korea, Democratic Peoples Republic (North Korea) | 57817 | 19208 | 3.01 | 224280 | 74511 | 3.01 | -74.22% | -74.22% | 0.00% |
| Korea, Republic (South Korea) | 3856260 | 4393189 | 0.88 | 1604748 | 1722625 | 0.93 | 140.30% | 155.03% | -5.77% |
| Kuka Islands | 91392 | 50164 | 1.82 | 100.00% | 100.00% | 100.00% | |||
| Latvia | 2058488 | 6107214 | 0.34 | 538421 | 1770734 | 0.30 | 282.32% | 244.90% | 10.85% |
| Lithuania | 8411613 | 6116553 | 1.38 | 4632974 | 4087849 | 1.13 | 81.56% | 49.63% | 21.34% |
| Magadascar | 282360 | 46141 | 6.12 | 88397 | 15592 | 5.67 | 219.42% | 195.93% | 7.94% |
| Malaysia | 1459782 | 619695 | 2.36 | 1184595 | 435204 | 2.72 | 23.23% | 42.39% | -13.46% |
| Mauritania | 42737866 | 43319921 | 0.99 | 36435984 | 45305936 | 0.80 | 17.30% | -4.38% | 22.67% |
| Mauritius | 47860 | 49851 | 0.96 | -100.00% | -100.00% | -100.00% | |||
| Micronesia, Federative States | 2948 | 40 | 73.70 | -100.00% | -100.00% | -100.00% | |||
| Mongolia | 19649 | 65549 | 0.30 | 57420 | 122281 | 0.47 | -65.78% | -46.39% | -36.16% |
| Morocco | 2105557 | 963530 | 2.19 | 667571 | 791676 | 0.84 | 215.41% | 21.71% | 159.15% |
| Mozambique | 200282 | 58288 | 3.44 | 27547 | 8997 | 3.06 | 627.06% | 547.86% | 12.22% |
| Myanma | 120137 | 20023 | 6.00 | 100.00% | 100.00% | 100.00% | |||
| Namibia | 91800 | 54000 | 1.70 | 82651 | 50376 | 1.64 | 11.07% | 7.19% | 3.62% |
| Netherlands | 6795207 | 4038172 | 1.68 | 1883800 | 1274763 | 1.48 | 260.72% | 216.78% | 13.87% |
| New Zealand | 9923293 | 6673971 | 1.49 | 9138554 | 7455655 | 1.23 | 8.59% | -10.48% | 21.31% |
| Nigeria | 7789 | 96 | 81.14 | 2225 | 21 | 105.95 | 250.07% | 357.14% | -23.42% |
| Norway | 629309616 | 372556229 | 1.69 | 436875691 | 267934329 | 1.63 | 44.05% | 39.05% | 3.60% |
| Peru | 13889252 | 9518764 | 1.46 | 8181487 | 5327559 | 1.54 | 69.76% | 78.67% | -4.98% |
| Philippines | 50610 | 7230 | 7.00 | -100.00% | -100.00% | -100.00% | |||
| Poland | 234056 | 1326000 | 0.18 | 301274 | 1998328 | 0.15 | -22.31% | -33.64% | 17.08% |
| Portugal | 235797 | 120323 | 1.96 | 183086 | 57094 | 3.21 | 28.79% | 110.75% | -38.89% |
| Russia | 3514813 | 2221124 | 1.58 | 2110178 | 2667549 | 0.79 | 66.56% | -16.74% | 100.04% |
| Singapore | 3997976 | 1675064 | 2.39 | 1157089 | 357297 | 3.24 | 245.52% | 368.82% | -26.30% |
| South Africa | 504373 | 414168 | 1.22 | 157331 | 125865 | 1.25 | 220.58% | 229.06% | -2.58% |
| Spain | 13423375 | 8374734 | 1.60 | 9023715 | 6347911 | 1.42 | 48.76% | 31.93% | 12.76% |
| Sri Lanka | 120864 | 21080 | 5.73 | 103777 | 1951 | 53.19 | 16.47% | 980.47% | -89.22% |
| Sweden | 1817575 | 3363601 | 0.54 | 1628246 | 2966512 | 0.55 | 11.63% | 13.39% | -1.55% |
| Taiwan (China) | 15793809 | 9271497 | 1.70 | 4204715 | 4173221 | 1.01 | 275.62% | 122.17% | 69.07% |
| Thailand | 31894488 | 13275868 | 2.40 | 24180386 | 10729738 | 2.25 | 31.90% | 23.73% | 6.61% |
| Tunis | 501491 | 58414 | 8.59 | 381492 | 63902 | 5.97 | 31.46% | -8.59% | 43.81% |
| Turkey | 903901 | 205622 | 4.40 | 100.00% | 100.00% | 100.00% | |||
| Ukraine | 1099588 | 201436 | 5.46 | 164216 | 40000 | 4.11 | 569.60% | 403.59% | 32.97% |
| United Arab Emirates | 136686 | 14565 | 9.38 | 247991 | 58498 | 4.24 | -44.88% | -75.10% | 121.37% |
| United Kingdom of Great Britain and Northern Ireland | 87346348 | 53825518 | 1.62 | 55214555 | 36000650 | 1.53 | 58.19% | 49.51% | 5.81% |
| United States of America | 51674334 | 25486826 | 2.03 | 44119261 | 26448031 | 1.67 | 17.12% | -3.63% | 21.54% |
| Uruguay | 5611405 | 3923067 | 1.43 | 6291561 | 4635232 | 1.36 | -10.81% | -15.36% | 5.38% |
| Uzbekistan | 663802 | 404799 | 1.64 | 493753 | 440890 | 1.12 | 34.44% | -8.19% | 46.43% |
| Vietnam | 113861789 | 58321960 | 1.95 | 106790370 | 53508660 | 2.00 | 6.62% | 9.00% | -2.18% |
| Yemen | 40137 | 24298 | 1.65 | 100.00% | 100.00% | 100.00% | |||
| TOTAL | 1731373129 | 997609247 | 1.74 | 1205166652 | 773441828 | 1.56 | 43.66% | 28.98% | 11.38% |
Note: The table is compiled by FISHNET analysts (http://www.fishnet-russia.com/, https://www.fishnet.ru/) from official figures of Russia's Federal Customs Service.